

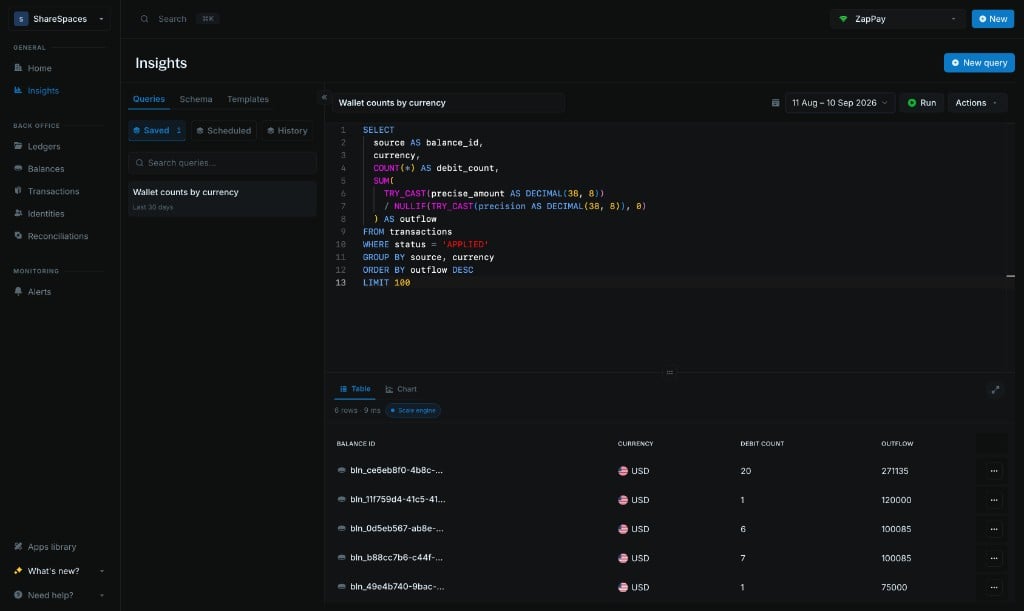
Insights and the Data Lake are available only on managed instances and to Enterprise customers. They are not included with connected self-hosted Cores without an Enterprise license.
SELECT queries to answer questions such as:
- How has transaction volume grown month over month, broken down by currency?
- Which customers account for the largest share of transaction volume, and how has that concentration changed?
- What percentage of transaction value was refunded each month, and which customer segments drove the increase?
- Of the customers who first transacted in January, how many continued transacting in each subsequent month?
Create your first insight
Follow these steps to write, run, and save your first query in Insights.1
Open Insights
Select Insights from the side navigation.Check the active instance in the top-right corner of your screen to confirm you’re in the right environment. Insights queries the Data Lake associated with that instance.
2
Start a query
Click New query to open a blank SQL editor. Your draft is named Untitled lake query until you save it.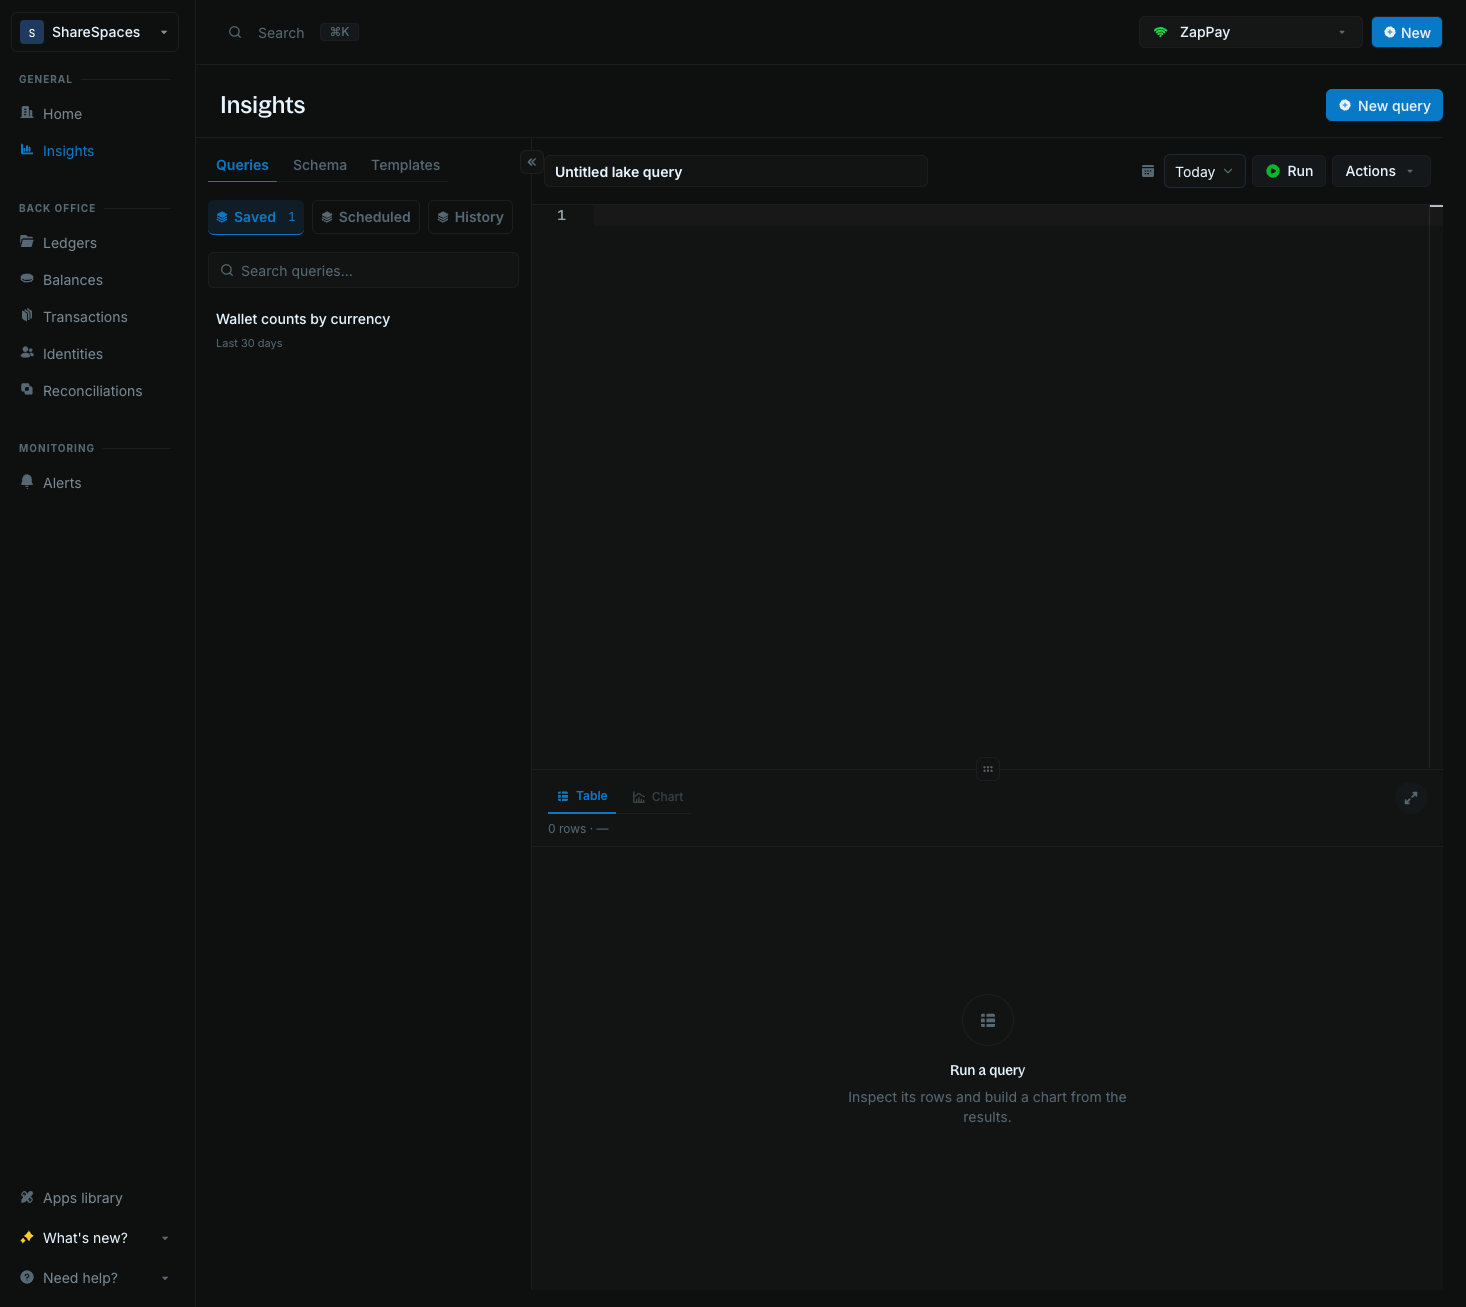
3
Choose a date range
Use the date picker in the toolbar to select the period you want to analyze. Choose a preset or enter custom start and end dates.Limit the range to the period your report needs. See Data Lake to understand how the date range affects your query.
4
Run your query
Paste a read-only DuckDB 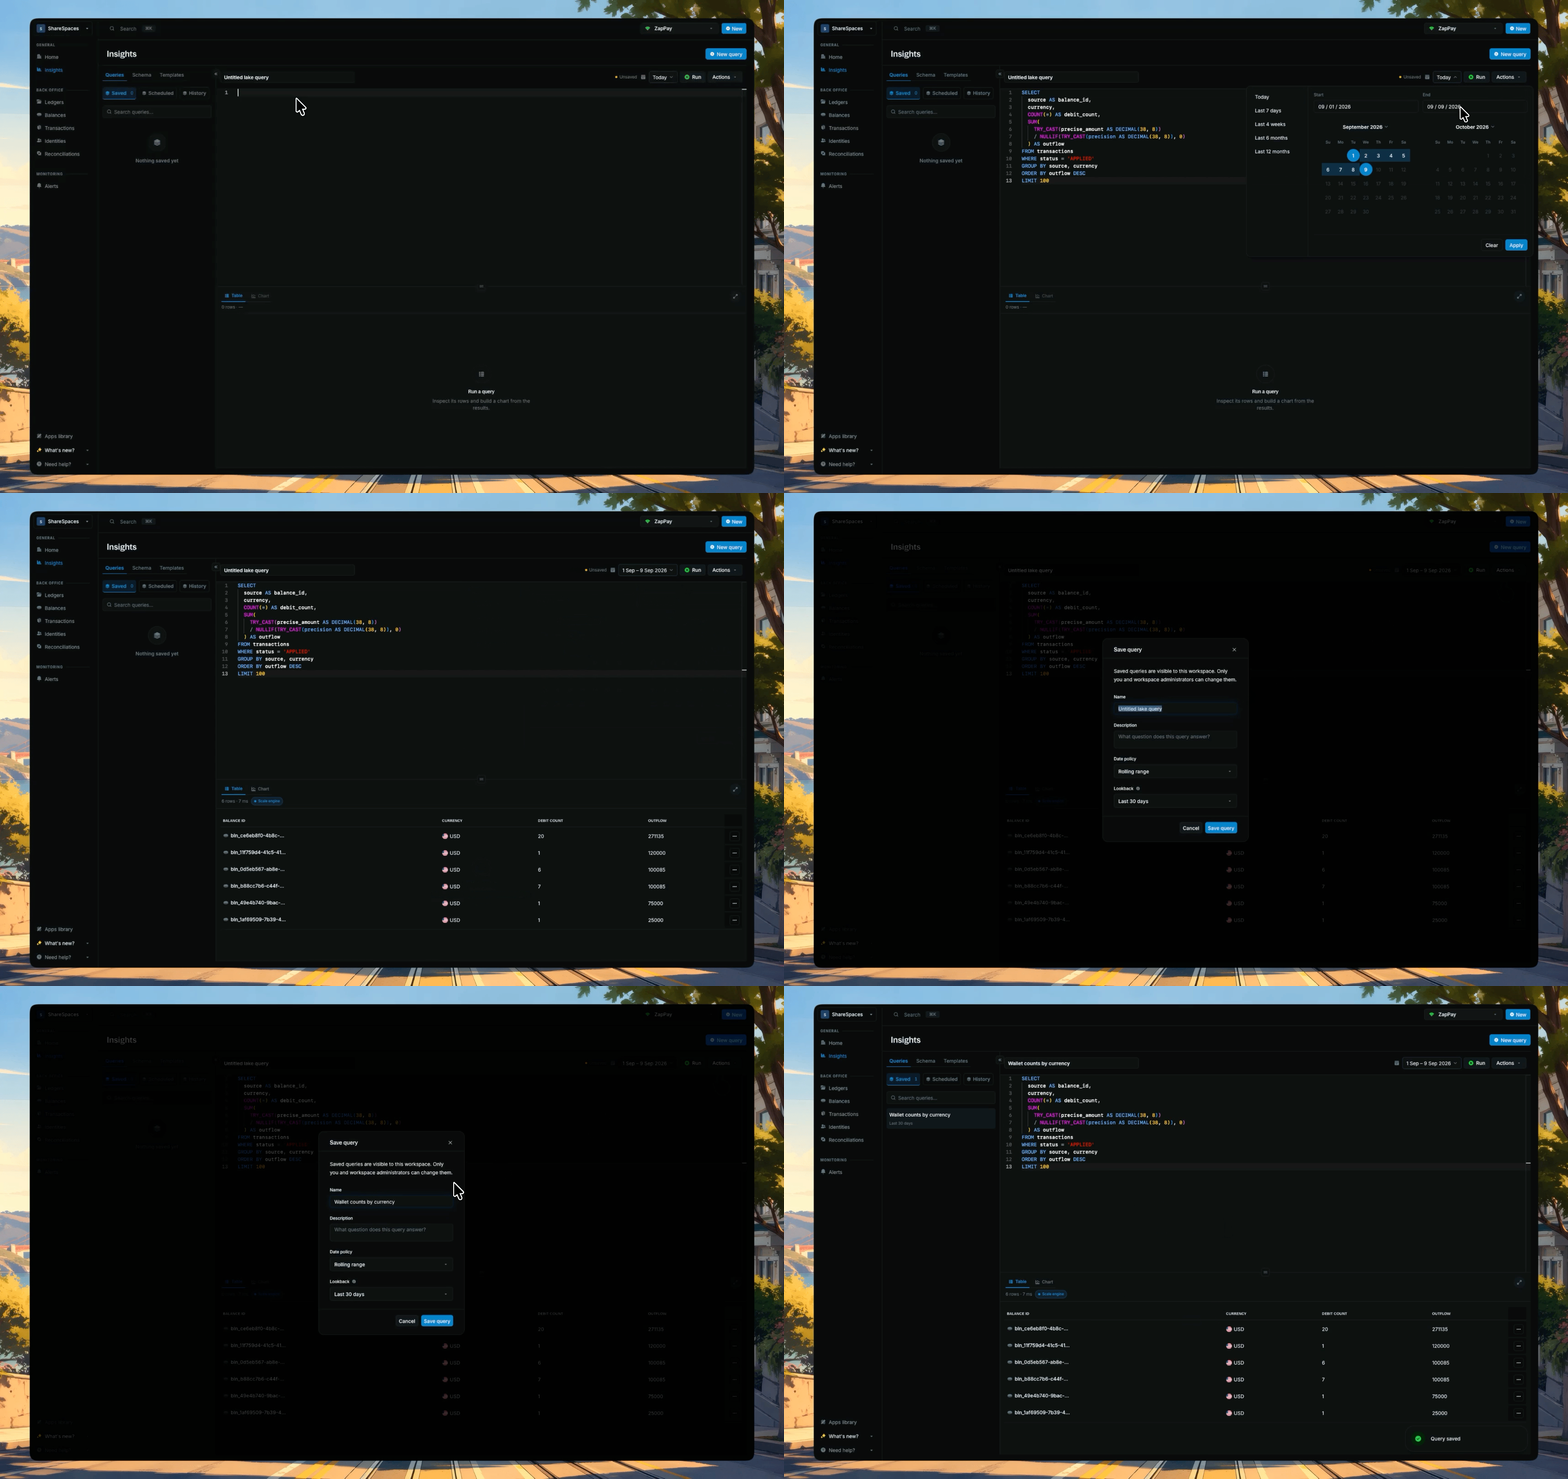
SELECT or WITH from a template or the editor.Click Run, or press ⌘ + Enter on macOS or Ctrl + Enter on Windows and Linux. Once the query completes, use Table to inspect the returned rows or Chart to visualize the results.5
Save your query
Give your query a descriptive name and click Save to store it on the active instance.You can reopen it from the Queries tab whenever you need it.