

Available in version 0.10.3 and later.
Example configuration
blnk.json
- Environment variable:
BLNK_QUEUE_MONITORING_PORT - Dashboard URL: Visit
http://localhost:5004/monitoringin your browser to access the real-time monitoring dashboard.
Web Dashboard
The dashboard provides a visual overview of your queue system: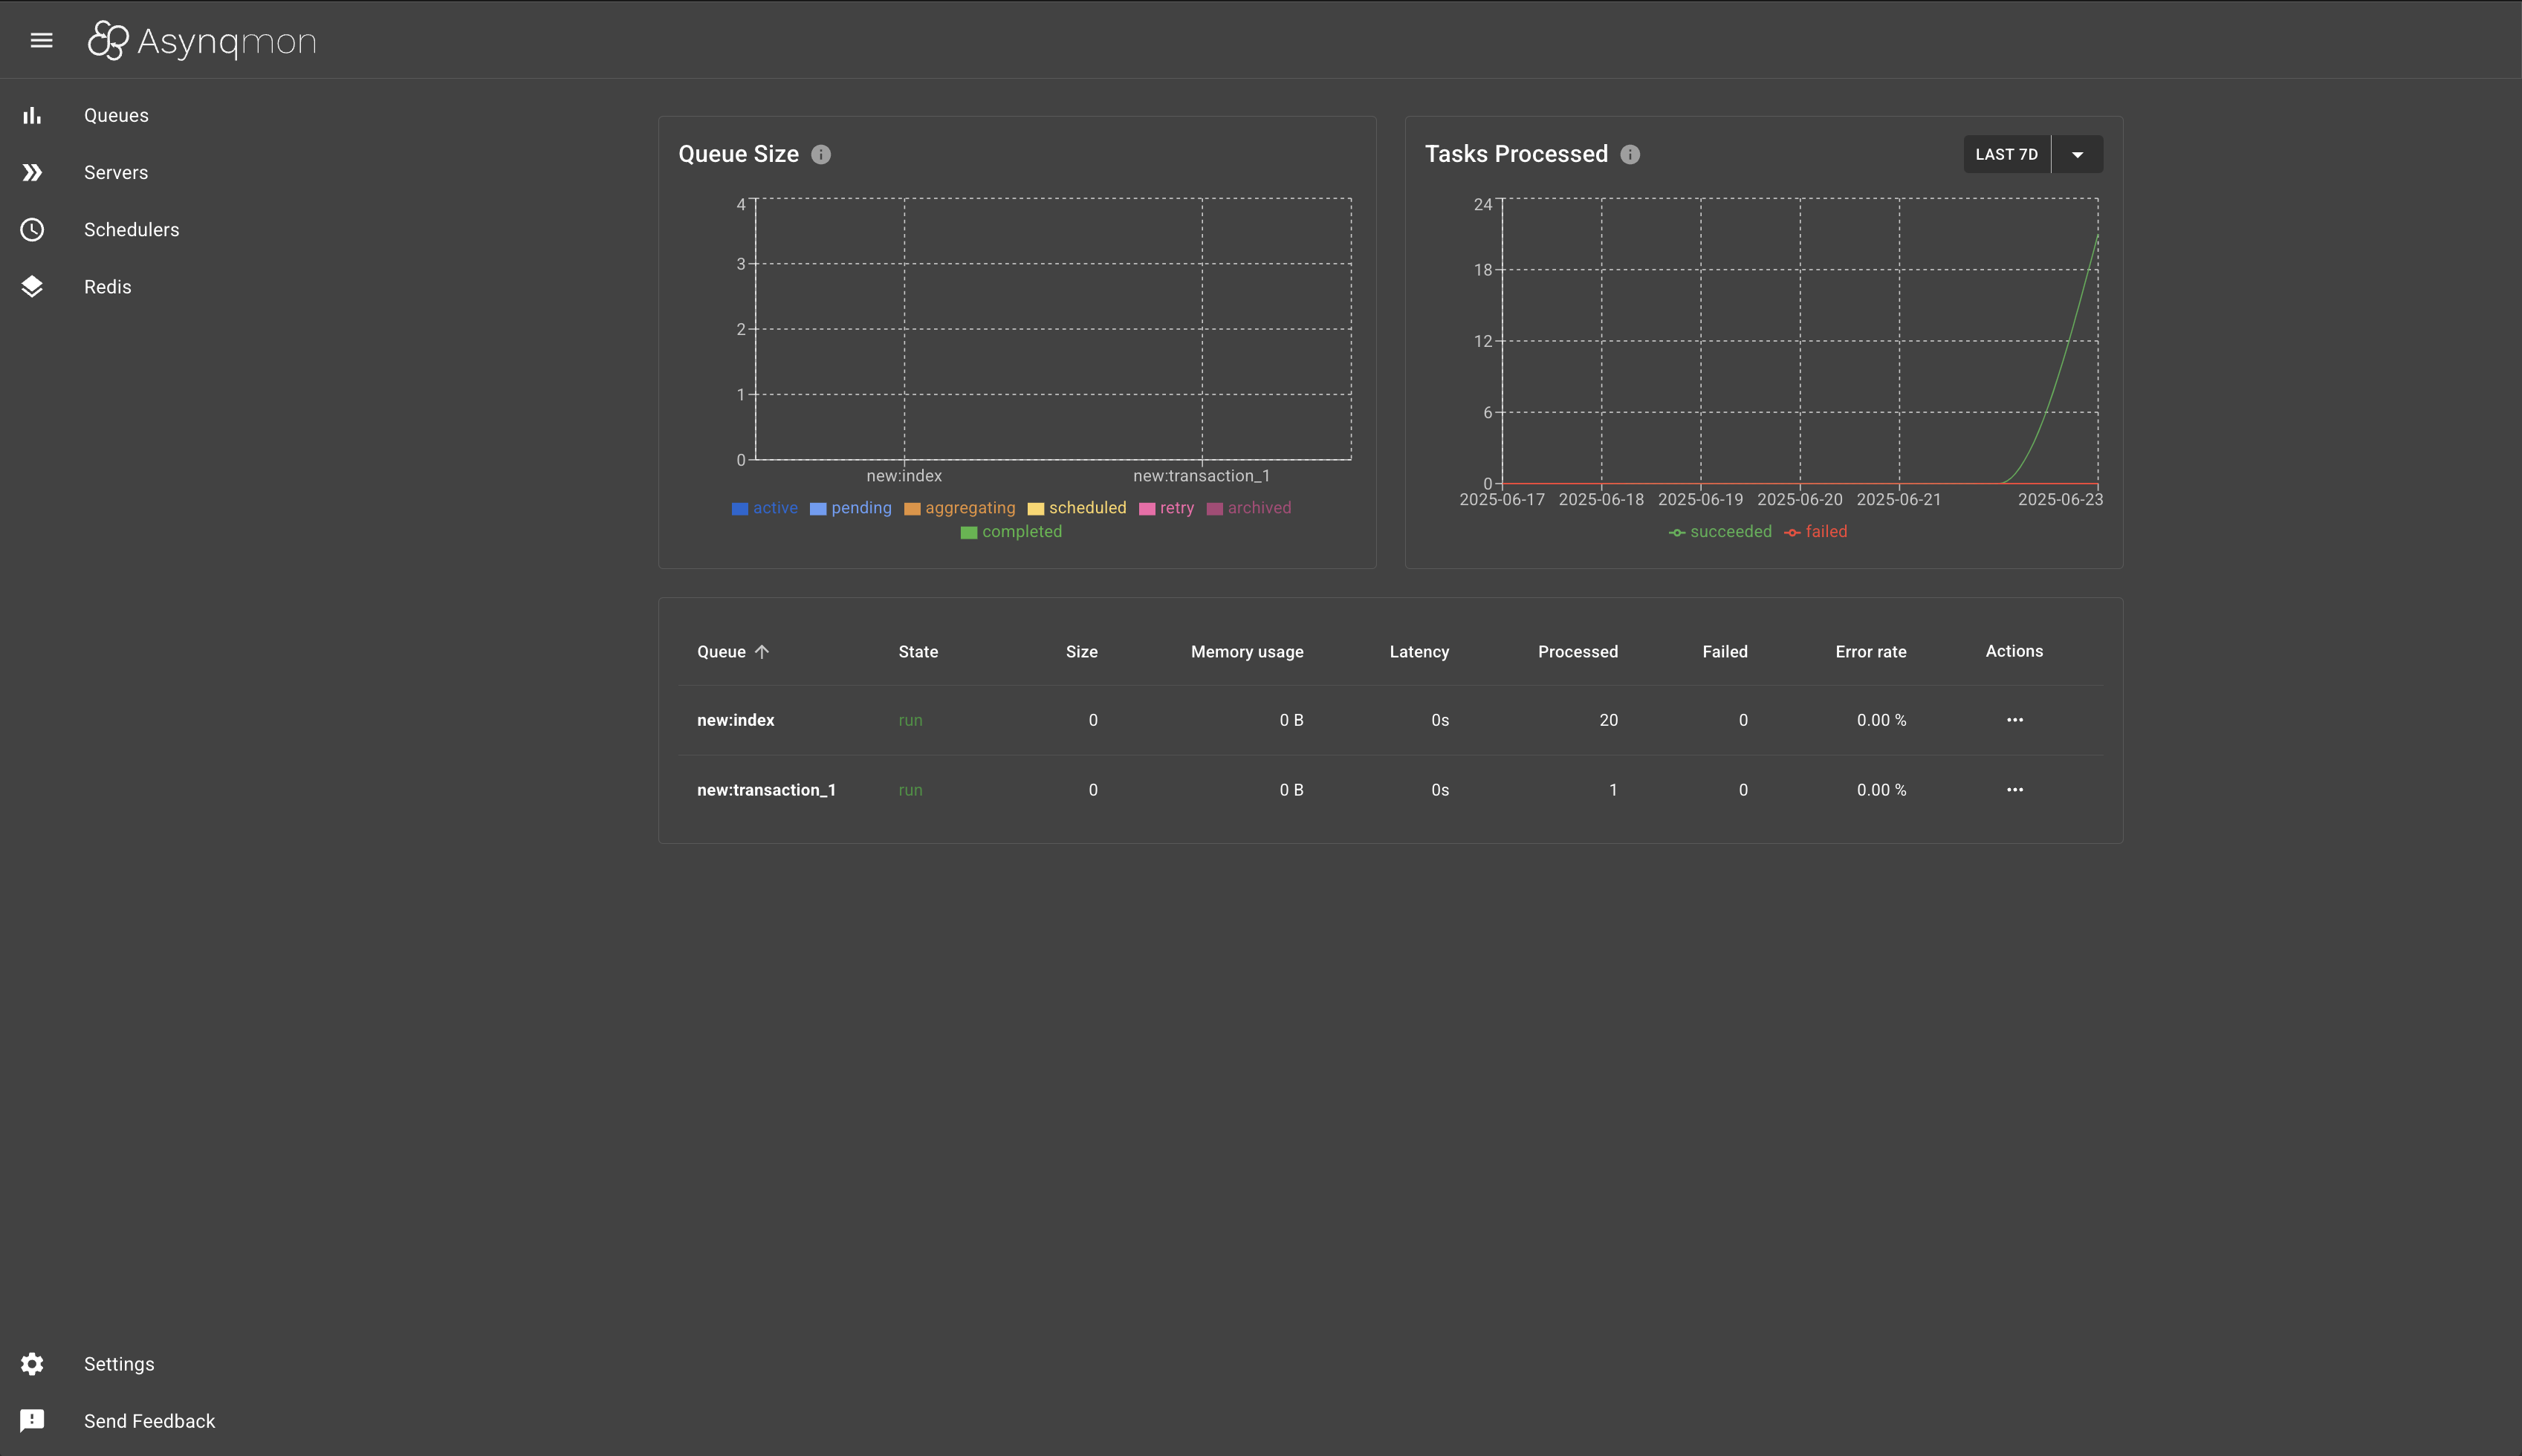
| Feature | Description |
|---|---|
| Queue Size | Visualizes the number of tasks in each queue, broken down by status (active, pending, aggregating, scheduled, retry, archived, completed). |
| Tasks Processed | Shows a graph of succeeded and failed tasks over time. |
| Queue Table | Lists all queues with their current state, size, memory usage, latency, processed/failed counts, and error rates. |
| Actions | Provides controls for queue management and inspection. |