> ## Documentation Index
> Fetch the complete documentation index at: https://docs.blnkfinance.com/llms.txt
> Use this file to discover all available pages before exploring further.
# Insights
> Learn what insights are.
export const CtaCallout = props => {
const {title, buttonLabel, href, trackingEvent, buttonTarget, rel = "noopener noreferrer", children} = props;
const handleCtaClick = () => {
if (typeof window === "undefined" || !trackingEvent) {
return;
}
try {
window.dispatchEvent(new CustomEvent("blnk:docs-cta", {
detail: {
name: trackingEvent,
href
}
}));
} catch {}
try {
window.posthog?.capture?.(trackingEvent, {
href
});
} catch {}
const gaPayload = {
cta_href: href
};
try {
window.gtag?.("event", trackingEvent, gaPayload);
} catch {}
try {
window.dataLayer = window.dataLayer || [];
window.dataLayer.push({
event: trackingEvent,
...gaPayload
});
} catch {}
};
const isExternal = typeof href === "string" && (/^https?:\/\//i).test(href);
const target = buttonTarget ?? (isExternal ? "_blank" : undefined);
const linkRel = isExternal ? rel : undefined;
return ;
};
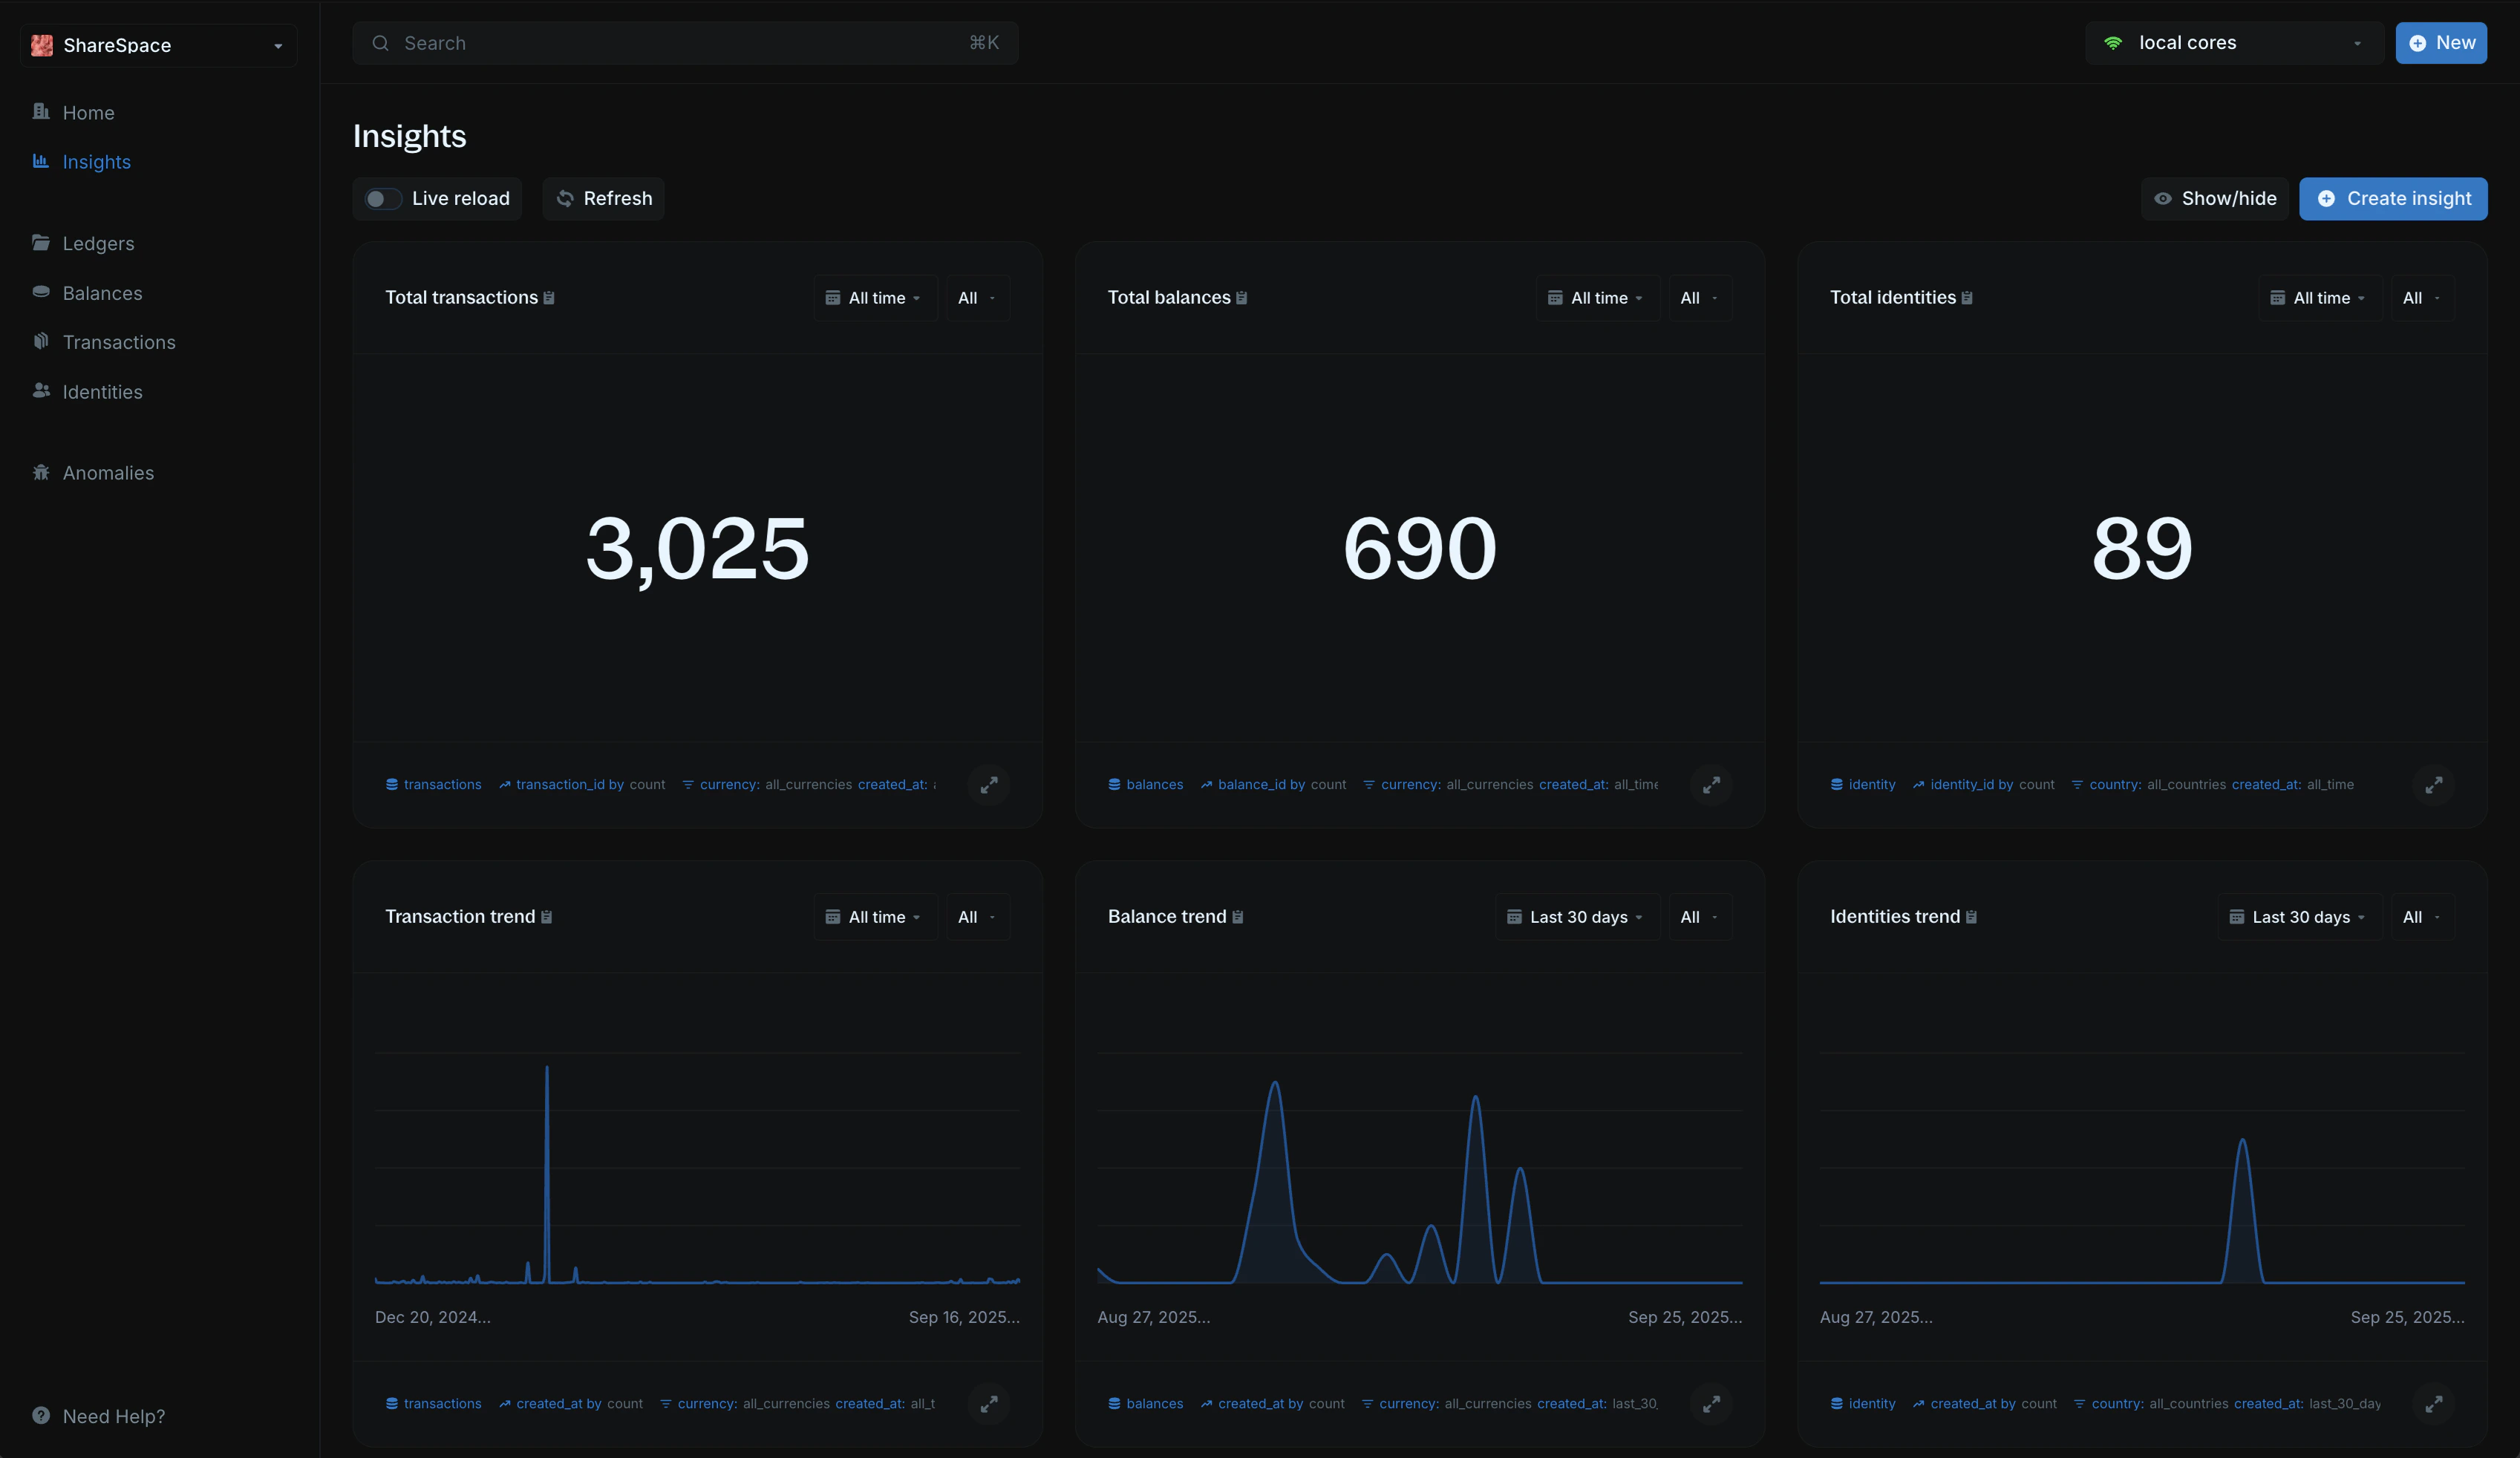
Insights give you a clear view of what's happening across your ledger.
They provide quick, visual reports on balances, transactions, identities, etc. so you can monitor activity at a glance.
 ***
## Working with insights
### Default visualizations
When you connect your Core, Blnk generates six visualizations for you by default:
* **Total transactions** - the total number of transactions recorded.
* `Total balances` - the number of balances created in your ledger.
* **Total identities** - the number of identities registered.
* **Transaction trend** - how transactions have changed over time (last 30 days by default).
* **Balance trend** - the growth of balances over time.
* **Identities trend** - the growth of identities over time.
Each default visualization can be filtered by time range and currency to fit your reporting needs.
### Live reload
Turn on **Live reload** to automatically refresh your visualizations with the latest data every 10 seconds.
***
## Working with insights
### Default visualizations
When you connect your Core, Blnk generates six visualizations for you by default:
* **Total transactions** - the total number of transactions recorded.
* `Total balances` - the number of balances created in your ledger.
* **Total identities** - the number of identities registered.
* **Transaction trend** - how transactions have changed over time (last 30 days by default).
* **Balance trend** - the growth of balances over time.
* **Identities trend** - the growth of identities over time.
Each default visualization can be filtered by time range and currency to fit your reporting needs.
### Live reload
Turn on **Live reload** to automatically refresh your visualizations with the latest data every 10 seconds.
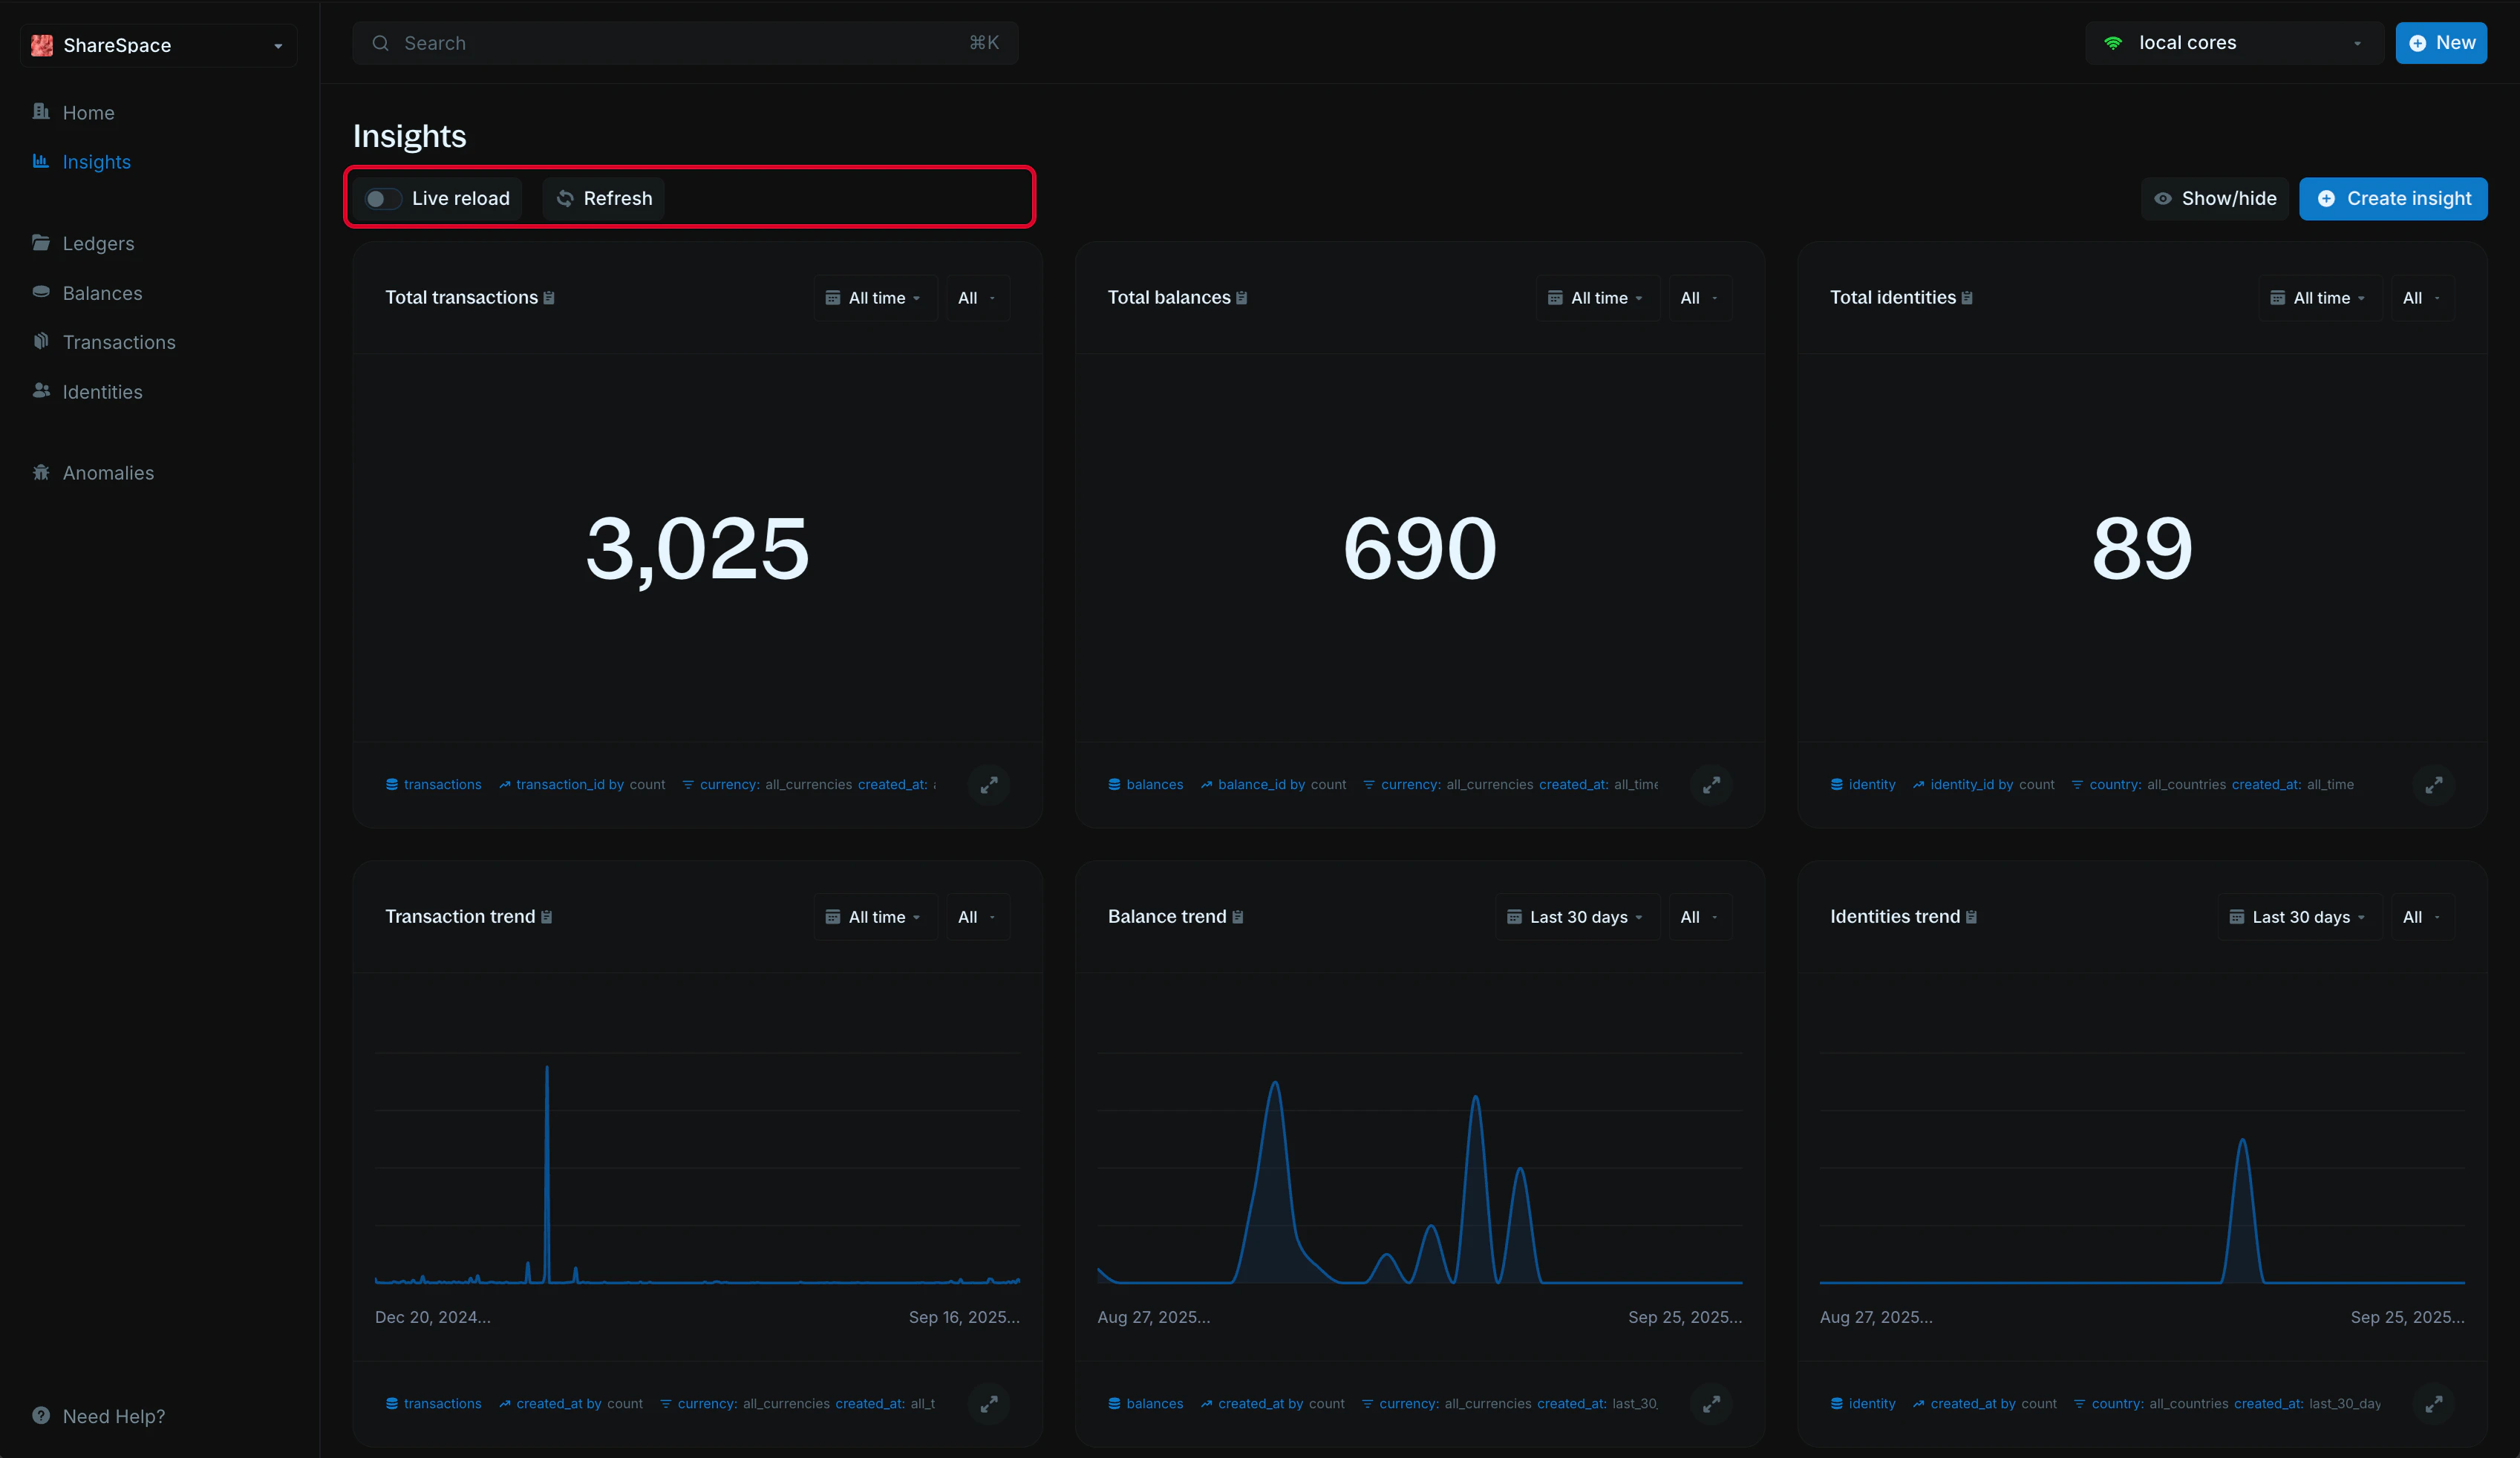 If turned off, you'll need to click `Refresh` to update them manually.
### Show/hide visualizations
If you don't need a particular visualization, you can toggle it off using the Show/Hide option. This makes it easy to focus only on the data that matters to you.
To do this:
1. Click the `Show/Hide` option in the top right corner of the Insights page.
2. Select which visualizations you want to show or hide.
If turned off, you'll need to click `Refresh` to update them manually.
### Show/hide visualizations
If you don't need a particular visualization, you can toggle it off using the Show/Hide option. This makes it easy to focus only on the data that matters to you.
To do this:
1. Click the `Show/Hide` option in the top right corner of the Insights page.
2. Select which visualizations you want to show or hide.
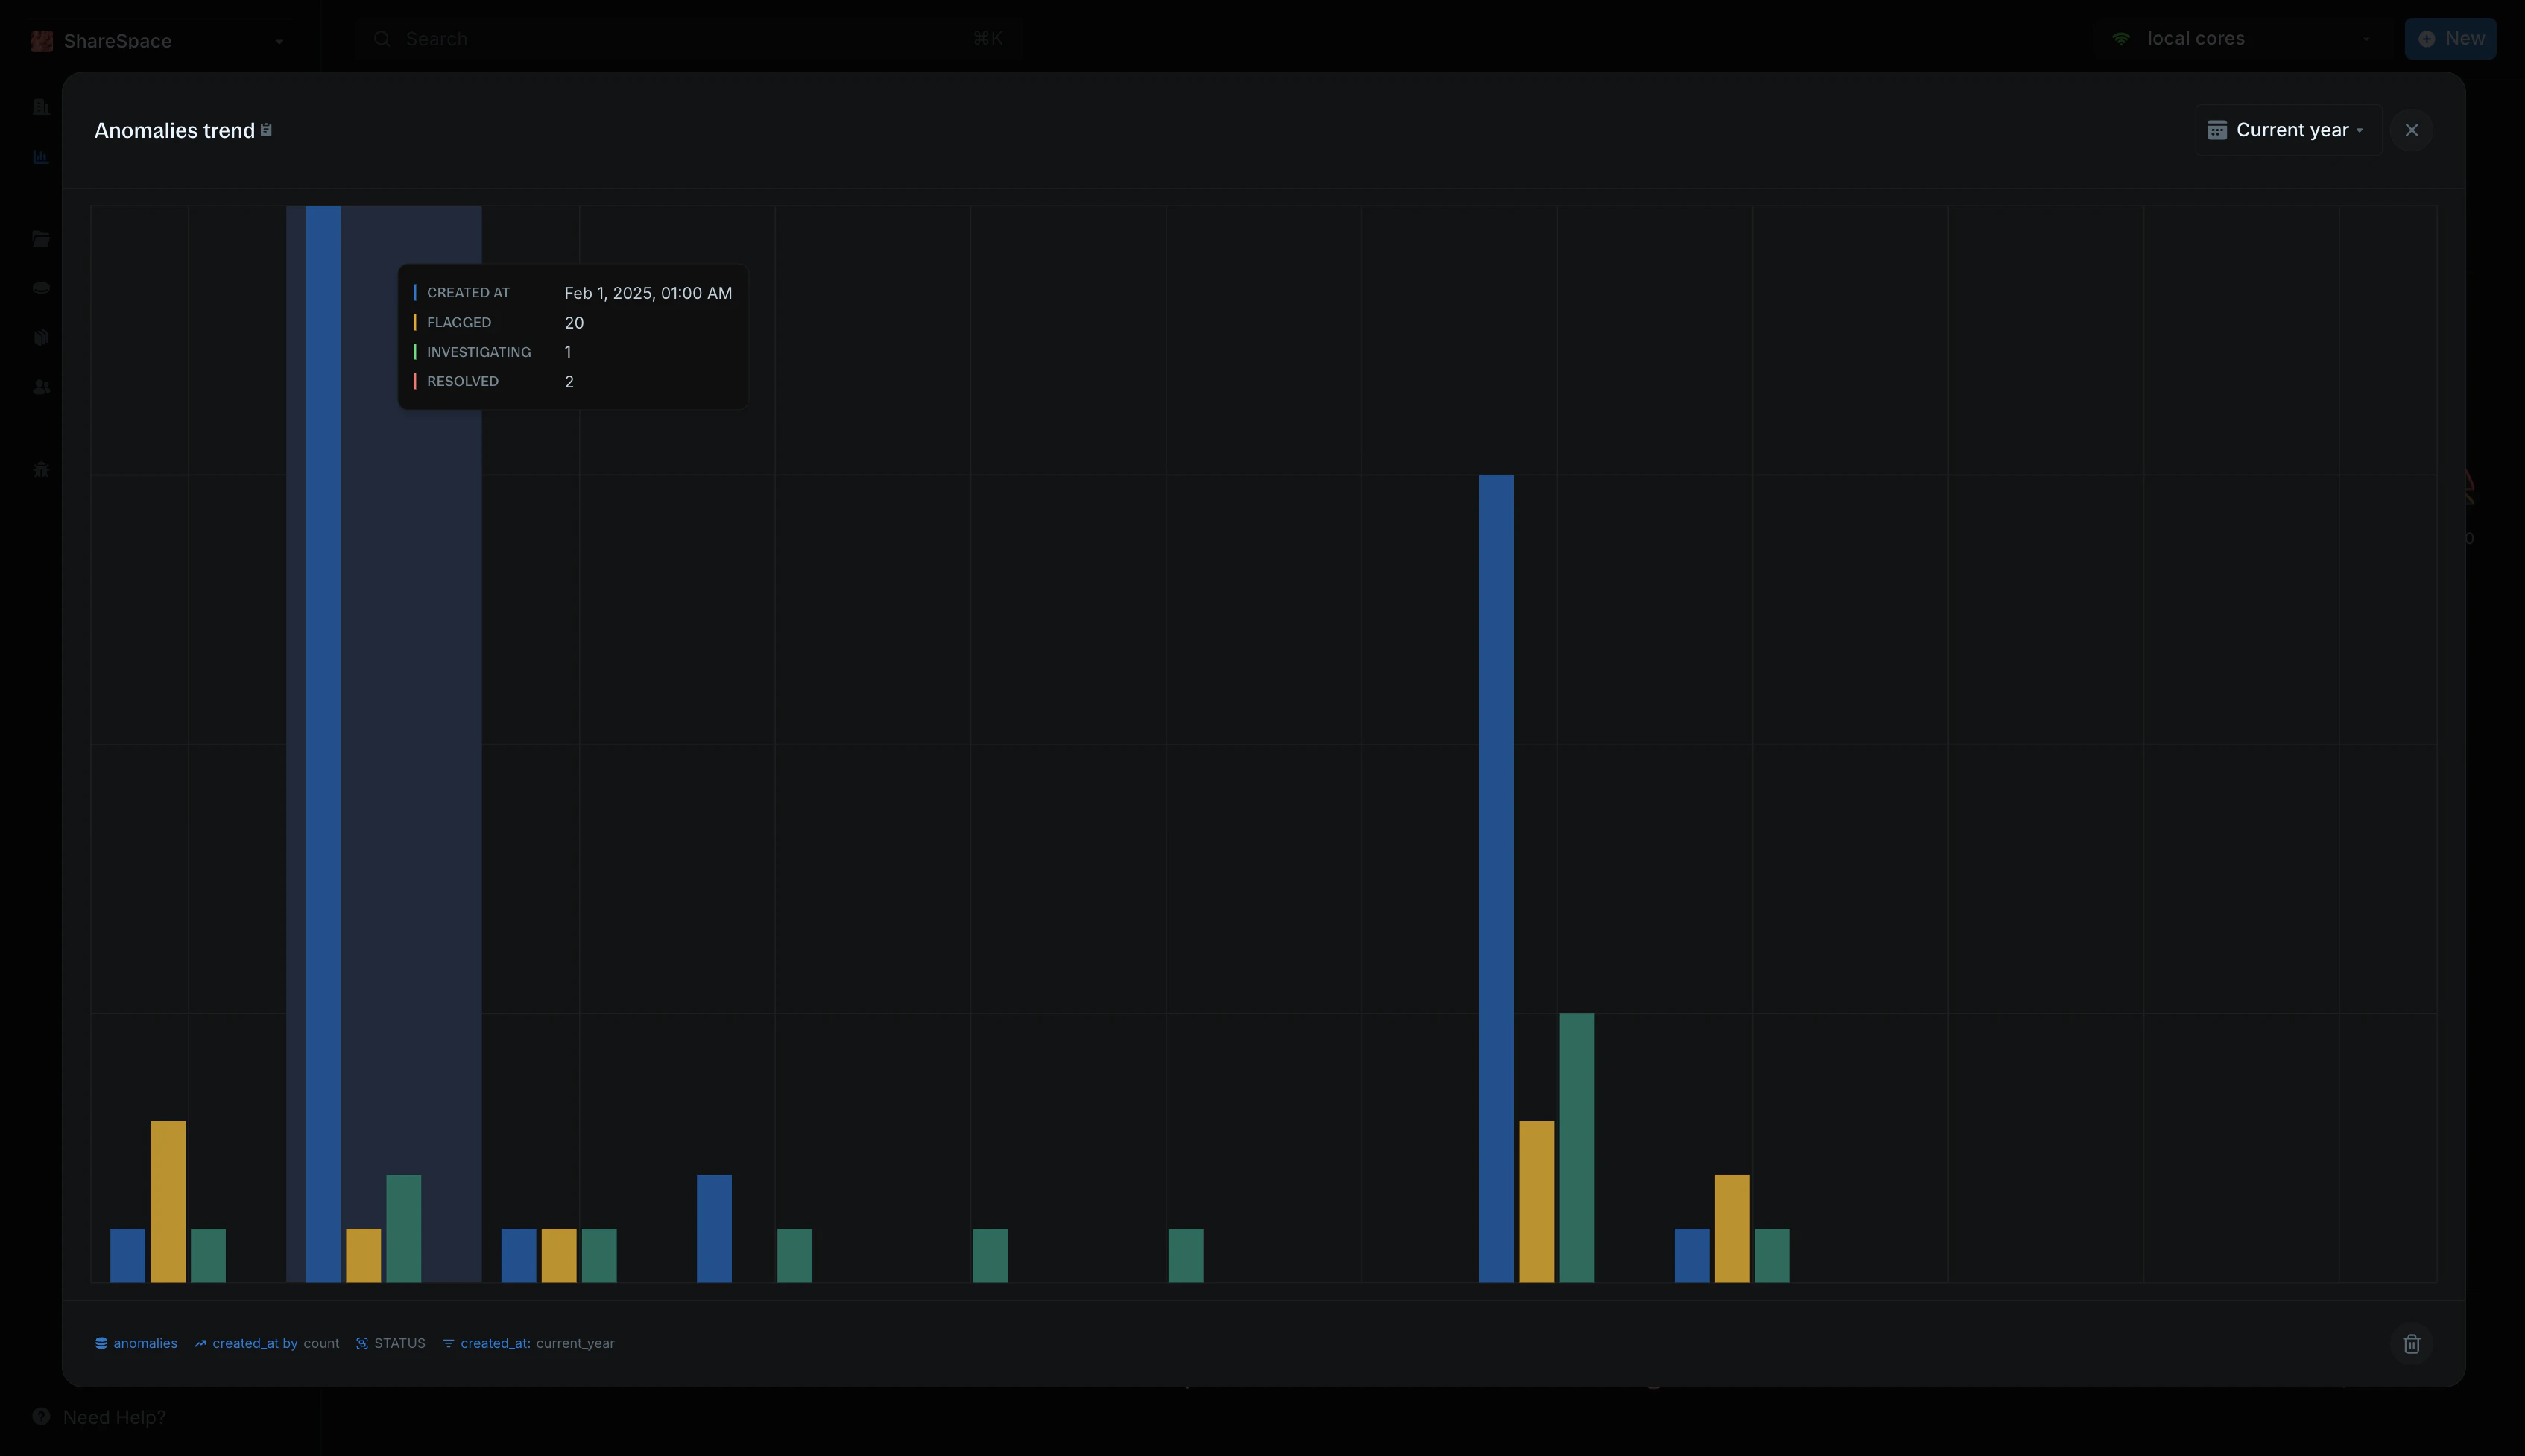
 ### Full screen view
Insights can be opened in Full Screen view by selecting the expand icon in the bottom right corner of each visualization.
### Full screen view
Insights can be opened in Full Screen view by selecting the expand icon in the bottom right corner of each visualization.
 ***
## Need help?
We are very happy to help you make the most of Blnk, regardless of whether it is your first time or you are switching from another tool.
To ask questions or discuss issues, please [contact us](mailto:support@blnkfinance.com) or [join our Discord community](https://discord.gg/7WNv94zPpx).
Get dedicated support for architecture reviews, integration planning, ledger workflows, and production deployment.
***
## Need help?
We are very happy to help you make the most of Blnk, regardless of whether it is your first time or you are switching from another tool.
To ask questions or discuss issues, please [contact us](mailto:support@blnkfinance.com) or [join our Discord community](https://discord.gg/7WNv94zPpx).
Get dedicated support for architecture reviews, integration planning, ledger workflows, and production deployment.